- Title: The Lesser Role of Starbursts for Star Formation at z = 2
- Authors: G. Rodighiero, E. Daddi, I. Baronchelli, A. Cimatti, A. Renzini, H. Aussel, P. Popesso, D. Lutz, P. Andreani, S. Berta, A. Cava, D. Elbaz, A. Feltre, A. Fontana, N. M. Forster Schreiber, A. Franceschini, R. Genzel, A. Grazian, C. Gruppioni, O. Ilbert, E. Le Floch, G. Magdis, M. Magliocchetti, B. Magnelli, R. Maiolino, H. McCracken, R. Nordon, A. Poglitsch, P. Santini, F. Pozzi, L. Riguccini, L.J. Tacconi, S. Wuyts, G. Zamorani
- First Author’s Institution: Dipartimento di Astronomia, Universita’ di Padova, Vicolo dell’Osservatorio 3, I-35122, Italy
Introduction
Two modes of star formation are widely recognized: the gradual formation of stars in gaseous disks, and the high-intensity epochs of star formation known as “starbusts,” which are theorized to result from major galaxy mergers and the sudden coalescence of dense gas. (Evan’s post from earlier this week discusses examples of mergers driving gas together to fuel AGN and starbursts. This paper provides a comprehensive description of one theoretical model for mergers and their effects on galaxy evolution and starburst activity.) However, research remains ongoing as to the relative importance of each mode for the star formation history of the universe. In this study, the authors example a sample of ~ 20,000 galaxies spanning a redshift range from z=1.5 to z=2.5, so as to probe star formation at z ~ 2, approximately where the cosmic star formation rate is near its maximum over the course of cosmic history.
In this letter, the authors present new Herschel observations, which, combined with previous optical/near-IR data, argue that gradual star formation in disky galaxies predominates over merger-driven starbursts. This is particularly interesting because at an intermediate redshift of z ~ 2, major mergers are much more common than they are today, and would have the possibility of dominating that epoch of star formation. Until now, however, it has been difficult to derive accurate rates of star formation for these galaxies, as high star formation rates are often correlated with being optically thick. The far-IR capabilities of Herschel allow it to probe that regime.

Figure 1. Stellar mass – Star Formation Rate relation at 1.5 < z < 2.5. We use four main samples: the ”shallow” PACS-COSMOS sources (red filled circles), the deeper PACS-GOODS South (cyan squares), the BzK-GOODS sample (black filled circles) and the BzK-COSMOS sources (black dots). The solid black line indicates the main sequence (MS) for star-forming galaxies at z ∼ 2 defined by Daddi et al. (2007), while the dotted and dashed lines mark the loci 10 and 4 times above the MS (along the SFR axis), respectively. The star indicates the PACS source detected by Aztec at 1.1mm in the COSMOS field. In the smaller inset, we show the same information as in the main panel, however here the stellar mass is presented as a function of the SSFR. (Original Caption -- G. Rodighiero et al. 2011)
The authors combine two samples of galaxies in order to get a more complete statistical sample for analysis. They use the Herschel observations with the PACS camera (far-IR) to select the rarer galaxies with a high star formation rate (SFR). Meanwhile, they use K-band (near-IR) data to select galaxies across the parameter space of stellar mass (M*). In total, they analyze ~ 20,000 galaxies that span the SFR-vs-M* parameter space.
Results
Figure 1 shows the entire sample of galaxies in SFR-vs-M* space. The authors find that they can fit the number density of galaxies as a function of specific star formation rate (SSFR; this is SFR divided by stellar mass — which has units of inverse years) in four different mass bins as a Gaussian with a slight excess at high SSFR (see Figure 2). They define the peak of the Gaussian as the “main sequence” of star formation. They then choose a location 0.6 dex higher (about 2.5 sigma) in SSFR as a threshold to define “on-” and “off-” sequence galaxies.

Figure 2. Distribution of the SSFR for the four samples, corrected by the corresponding comoving volumes and after accounting for volume and selection incompleteness, splitted in four mass bins. The dotted-black, solid-black, cyan and red histograms correspond to the BzK-GOODS, BzK-COSMOS, PACS-GOODS South and PACS-COSMOS data-sets. Error bars are Poisson. The green curves show the Gaussian fits to the black-solid histograms. The green dashed vertical lines mark the vertex of each best-fit Gaussian, and the dotted black vertical lines +0.6 dex above show our choice to separate ON- and OFF-sequence galaxies along the SSFR distribution.
This is a somewhat arbitrary cut-off, chosen where the excess above Gaussian becomes noticeable, but it is also a conservative choice. This is because they now measure the contribution of “starburst” galaxies by the ratio of OFF/(ON + OFF) galaxies (see Figure 4, below). This means that, in fact, some of the OFF-sequence galaxies are almost certainly main-sequence (MS) galaxies, scattered to the tail by either measurement error, or due to intrinsic scatter in the SSFR of MS galaxies.
The main conclusions the authors draw can be seen in Figure 4. In the bottom and middle panels, respectively, we see that OFF sequence galaxies account for only ~ 2 % of the number density and only ~ 10% of the star formation density across all mass bins. Only when we select for galaxies with high SFR (top panel) do we see that OFF sequence galaxies account for a large percentage of star formation (46 +/- 20% for galaxies with SFR > 1000 M*/yr). Improvements in observational sensitivity in future instruments could allow these results to be tested in galaxies of lower stellar mass.
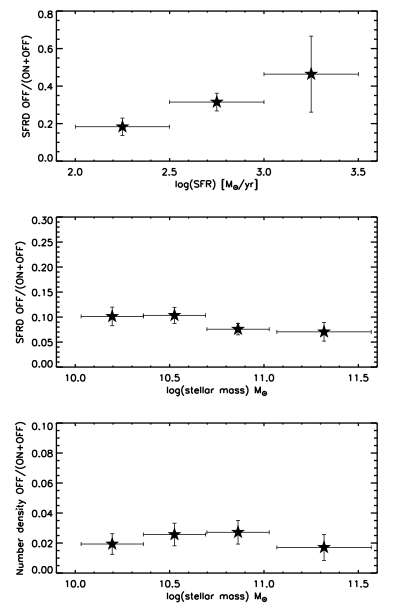
Figure 4. Contribution of OFF sequence galaxies to the total SFR density in different SFR bins (top panel) and stellar mass bins (middle panel). In the bottom panel we also report the num- ber density percentage of OFF sequence sources. Error bars are Poisson. (Original Caption -- G. Rodighiero et al. 2011)
Thus, the authors conclude that while mergers may account for significant changes in the morphological properties of galaxies, providing the transition from spirals to an elliptical — and that they may serve to quench star formation, quickly exhausting the gas — they do not account for the majority of star formation.
However, this is not to say that it is unimportant. Even 10% of star formation density — across a large mass range — is a relatively significant contribution. It may be that some modeling can ignore this fraction and still get reasonably accurate global properties of galaxies. But starbursts likely remain important for understanding more local stellar properties and structures in individual galaxies. The paper shows, though, that the early universe is not, for most stars, the dramatic and glorious environment of starbursts.

Trackbacks/Pingbacks