Title: The Radial Distribution of Star Formation in Galaxies at z~1 from the 3D-HST Survey
Authors: Erica Nelson et al.
First Author’s Institution: Yale University
One of the reasons I think galaxy formation and evolution are so interesting to me as an astronomer is the fact that galaxies only form once. Of course, there are billions of galaxies, each of which starts getting its act together at a different time, but in the entire history of the Universe, we can point to a single, special time when lots of galaxies were all forming stars—and as far as we can tell, nothing like that will ever happen again. Unfortunately, the same thing that makes galaxy evolution so interesting (to me) is the same thing that has made it so hard to actually say something significant about how galaxies form. Until the discovery of quasars in the 1960s, the high-redshift Universe wasn’t even something people thought about, and it’s only in the last few years that advances in instrumentation have allowed us to go out and observe large numbers of galaxies in the earlier Universe. The near-infrared grism capability of the Hubble Space Telescope is one such innovation, and a team of astronomers working on the 3D-HST Survey (which I’ve talked about before) have recently used it to investigate the radial distribution of star formation in galaxies, which may tell us something about how galaxies were built up in the past. Spoiler alert: it looks like galaxies were already forming stars in disks like the Milky Way’s as early as seven billion years ago!
The key to the work done in this paper is efficient spectroscopy, since the goal of survey projects like 3D-HST is to be able to say something about a large sample of objects. To obtain an ordinary spectrum, the light from an object is focused on a narrow slit and split up into many different wavelengths using a grating. In grism (or slitless) spectroscopy, the dispersive element (in this case, a grism) is placed in the light path of an ordinary imaging camera, so that every object on the image forms a small spectrum of its own. Imagine looking at the world through a prism: everything you looked at would be split into a rainbow, and it’s the same basic idea for grism spectroscopy. This kind of spectroscopy is usually lower resolution, meaning that it’s harder to tell one color of light from another, but it is much more efficient than single slit spectrographs, since you can observe every source in an image at once.
After you have a spectrum in hand, you can look to see if the amount of light coming out at each wavelength varies along the spatial direction (perpendicular to the direction in which the light is dispersed), so it’s important to choose a telescope that will give you high spatial resolution. HST is a good choice because of its location above the atmosphere, where it can achieve much higher spatial resolution than most ground-based telescopes. Making use of both the efficiency of the grism mode and the spatial resolution of HST, the 3D-HST team published a previous paper looking at resolved maps of light from a single spectroscopic emission line for 57 galaxies, all at redshift around 1 (back when the Universe was a little less than half its current age). That study marks the starting point for the more recent paper, which we’re talking about today.
In both papers, though, the authors focus on the H-alpha emission line, which occurs when energetic photons from young, massive stars ionize the surrounding hydrogen and the hydrogen subsequently recombines. Because massive stars don’t live very long and therefore can’t continue photoionizing hydrogen for very long either, H-alpha emission is often used as a tracer of how many massive stars are currently being formed. If you know what fraction of the total number of stars being formed are massive stars (astronomers call this an initial mass function), then you can determine the total star formation using the H-alpha emission.

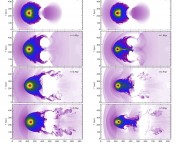
- Figure 1: Stacks of high-resolution H-alpha emission maps for galaxies binned by their observed size (in H-alpha). The dark purple represents the smallest galaxy size bin, the light purple is the medium size bin, and the pink is the largest size bin. Note that the H-alpha emission (which traces star-formation) can have a fairly shallow radial profile, unlike that typically observed for stars.

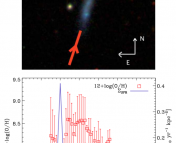
Figure 2: The rotation curves in H-alpha of three individual galaxies from the 3D-HST sample observed with NIRSPEC. The shape of the lines indicates a rapidly-rotating disk. If the gas at every position were moving at the same speed, the line would be straight up and down. Instead, for the first two galaxies, the gas at the top of the slit is moving towards us and the gas at the bottom of the slit is moving away from us, relative to the center of the galaxy.
The analysis in the new paper relies on grouping the galaxies based on their observed size and constructing stacked 2D maps of their H-alpha emission from the spectroscopic data (see Figure 1). The stacking technique improves the signal-to-noise of the line emission maps and allows the authors to more robustly investigate the radial distribution of H-alpha (and, therefore, star formation). What they find is that, for all bins, the radial profiles are nearly exponential, although the H-alpha emission (coming from regions of star formation) is often less strongly peaked than the continuum emission (which comes from all the stars). Physically, this implies that star formation is occurring on extended scales, not just in the nuclear regions of galaxies.
In addition to using data from HST, the authors also observed a subset of their sample using NIRSPEC, a near-infrared spectrograph on the W. M. Keck telescope in Hawaii. The data from NIRSPEC has higher spectral resolution than the spectra obtained using the HST grism, which means the authors can use it to say something about the internal kinematics (or motion) of the galaxy rather than just the morphology (or shape). As you can see in Figure 2, this complementary analysis revealed that, for a majority of the representative subset, the star formation was happening in a rotating disk (like the Milky Way’s disk).
The most important result of the paper is that seven billion years ago, star formation in highly star-forming galaxies was probably occurring in rotating, exponential disks that extended out to a radius of ~10 kpc (somewhat smaller than the Milky Way’s disk). This may mean that the increase in Universal star formation as we look back in time may have more to do with an increased amount of star formation in disks rather than when galaxies merge and trigger star formation in their centers. These results do leave some puzzles, though, especially in terms of how these disks formed and what the current-day counterparts of these disky, star-forming galaxies look like. In addition, the authors admit their sample is still incomplete, so stay tuned for more results as the 3D-HST team extends its study and tries to address some of these persistent scientific questions.