•Title: The Allen Telescope Array Search for Electrostatic Discharges on Mars
• Authors: Marin Anderson et al.
• First Author’s Institution: Department of Astronomy and Radio Astronomy Laboratory, University of California, Berkeley
Although electrostatic discharge has been observed in the atmospheres of several planets — Jupiter, Saturn, and Venus, not to mention Earth — Mars has until recently remained quiet in the lightning domain. This did not stop theorists, however, from hypothesizing about possible sources of Martian lightning. One likely candidate involves the frictional charging of dust grains in the atmosphere during large-scale dust storms.
In 2006, low-frequency peaks at 10 Hz were observed in the Martian spectrum during a large dust storm. They were attributed to Schumann resonances, which are low-frequency propagations of lightning in between the planet’s surface and ionosphere. The 2006 observations did not constitute a direct detection of lightning, but they did motivate this study. In this paper, the authors search for lightning in the radio spectrum of Mars, using a statistical technique known as the spectral kurtosis estimator to distinguish the real signal from random noise.
The Spectral Kurtosis Estimator
To determine whether Martian radio emission is non-thermal — that is, not resulting from the ambient temperature of the planet — the authors use the spectral kurtosis. This statistic measures the non-Gaussianity of a signal, and is generally used to remove man-made RFI (radio frequency interference) from radio measurements. Since most astronomical radio signals are drawn from a Gaussian random distribution, a terrestrial radio signal containing, for example, a talk radio show, will show a very large kurtosis and can then be removed from the spectrum.
The spectral kurtosis estimator, V, is built out of a ratio of the accumulated power and the accumulated square of the power in a spectral bin. In the presence of a Gaussian signal, V = 1. When the signal becomes non-Gaussian, V moves away from 1. Based on the statistics of V, the 3-sigma threshold for a non-Gaussian signal is V = 1 + 0.53.
Observations
The authors used the Allen Telescope Array (ATA), located at the Hat Creek Observatory in Northern California, which consists of 42 6.1-meter antennas. Observations were made at 3.2 and 8 GHz for a total of 30 hours between March and June of 2010, during both small-scale dust storms and during quiet periods.

The Allen Telescope Array
The ATA uses a time-domain beamformer to obtain a spectrum. The beamformer delays the signal from each antenna to create a synthesized beam, equivalent to that of a single dish with a diameter equal to the baseline separation between the antennas. This means that the resolution of the entire ATA is significantly better than that of a single 6.1-meter dish. There is a tradeoff, however, in sensitivity: the collecting area of several small dishes separated by a distance D is smaller than than a single dish of diameter D.
The time-domain data are then fed into a digital spectrometer, which computes a Fast Fourier Transform and outputs both the power and power squared as a function of frequency. At this point, the spectral kurtosis estimator is computed for each frequency bin.
Results
If non-thermal microwave emission (i.e. lightning) were present in the Martian atmosphere, we would expect the spectral kurtosis to deviate significantly from Gaussianity over a wide range of frequency channels. If there were also a modulation of this signal through Schumann resonance, low-frequency spectral peaks would also be present in the kurtosis. Ideal Schumann resonances are given by 
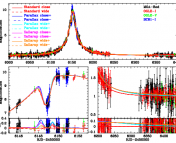
To test the validity of the kurtosis estimator, the authors observed several known non-thermal sources. For example, the spectral kurtosis of the satellite RADARSAT-1, shown below, indicates strong non-Gaussianity in several frequency bins.

Spectral Kurtosis as a function of time for the satellite RADARSAT-1. The kurtosis level at a certain time and frequency is indicated by the color; non-Gaussianity is generally darker (the 3-sigma level is indicated on the right). Note the strong non-Gaussian emission at 2230 MHz, which is the operating frequency of the satellite.
Below is an example of the spectral kurtosis for the Mars observations. Looking at the entire data set, peaks in the estimator are evident near 10 Hz and higher harmonics — during observations, there was on average one or two of these events per hour. However, by correlating between the 8 and 3.2 GHz bands, all of the non-Gaussian events were traced back to narrowband RFI (man-made radio communications). Apart from these man-made events, no other non-Gaussian signals were observed during Martian dust storms.

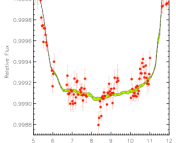
Spectral Kurtosis of Mars at 3.2 GHz. The non-Gaussian (darker) features are due to narrowband RFI.
Although this experiment did not detect Martian lightning, it did demonstrate the validity of the kurtosis method for excising RFI from radio spectra (which is an extremely important problem for radio astronomers!). The push to confirm lightning on Mars, however, continues on.